Subfertility is defined as the inability to achieve a clinical pregnancy after 12 months of unprotected “regular intercourse.” When talking about “regular intercourse,” the frequency of intercourse and its temporal relationship to ovulation must be taken into account.
Regarding frequency, it has been shown that the cumulative probability of pregnancy at one year increases when there are at least two coital relations per week (Table 1). (1) (2)
| Woman’s age | intercourse 2/week | Intercourse 1/week |
| 19 to 26 years | 8% | 15% |
| 27 to 34 years | 13-14% | 22-24% |
| 35 to 39 years | 18% | 29% |
Regarding timing, it has been documented that incorrect scheduling of coital relations with respect to the woman’s fertile days during the menstrual cycle affects the probability of pregnancy. The fertile days in which unprotected intercourse can result in conception are known as the “fertility window.” Although there is consensus that the fertility window ends on the day of ovulation, its start and therefore its duration varies between couples, with a range between
“Timed intercourse” is based on the ability to prospectively detect this fertility window and thus maximize the probability of conception. (4) Most women ovulate about 14 days before the first day of menstrual bleeding. However, because there is a high variation in the duration of menstrual cycles (counting from the first day of bleeding to the day before the next menstruation) between women and even in the same woman, the sole use of the menstrual calendar can be a fairly inaccurate method of predicting ovulation.
Transvaginal ultrasound performed by trained clinical personnel is the gold standard for establishing the time of ovulation. However, there are practical and economical home methods that can predict the fertile period in a large percentage of women.
These include measuring hormones in the urine such as luteinizing hormone (LH) and estrogens; tracking basal body temperature; and evaluating cervical mucus and saliva.
It is therefore important to review the pros and cons of each of these methods and the devices available on the market for their measurement so that women who start trying to get pregnant have a greater probability of achieving conception efficiently.
The popularity of web-based applications for detecting fertile days with software for use on smartphones is increasing. Although most of these applications are only based on the duration of menstrual cycles and the date of the last menstruation, there are already some that incorporate hormonal analysis, and/or monitoring of body temperature. (5)
Observation of cervical mucus throughout the menstrual cycle is the most economical and simple method to predict ovulation. Studies confirm that the presence of abundant mucus like egg white correlates with the day of ovulation (determined by pelvic ultrasound) ± 1 day, in 48 to 75% of women. When the period is extended to -1 to +2 days with respect to the day of ovulation, the sensitivity of the mucus to detect ovulation is equal to or greater than 90%. (4)
Cervical mucus is secreted by the cervical and endocervical glands at the entrance of the uterus. Its appearance varies throughout the menstrual cycle. It is thick, scarce, and viscous outside the ovulatory period, forming a barrier to the passage of sperm. During the ovulatory period, due to the action of estrogens, its water content increases, making it more fluid and receptive to the passage of sperm. Women perceive this type of mucus as a watery vaginal discharge that resembles raw egg white and that is stringy when stretched (Fig 1a and 1b). The presence of this “egg white-like” mucus can be used for programming directed intercourse.

Although currently out of use, the postcoital test is used to see if sperm are able to survive in the woman’s cervical fluids. This test is performed during the peri-ovulatory period, when the cervical mucus is more receptive to sperm penetration. The technique consists of inserting a speculum into the vagina by the doctor who takes a sample of mucus from the cervical canal. This fluid is analyzed microscopically to check the characteristics of the mucus and is considered positive in the presence of at least one sperm with progressive motility at a magnification of x400. The couple should have sexual relations 6 to 10 hours before their appointment. The use of lubricants or vaginal douches is not recommended. The usefulness of the postcoital test to evaluate the probability of spontaneous conception in couples with unexplained subfertility has been demonstrated. The determination of the fertility window by performing serial postcoital tests starting five days before the estimated day of ovulation to determine the first day of a normal interaction between sperm and cervical mucus in women with unexplained subfertility shows a significant correlation between the probability of conception and the duration of the fertility window defined as the time in days between the first day that a positive postcoital test is found and the day of ovulation determined by ultrasound. (3) When correcting for other variables, a fertility window of five days increases the probability of pregnancy 2.3 times with respect to a window of 3 days (hazard ratio (HR) 2.3; 95%% Confidence Interval (CI) 1.06 – 5.0, P=0.04) while a fertility window of only one day significantly decreases the probability of pregnancy (HR 0.12; 95%% CI 0.03 to 0.53, P=0.00). Validation studies of spontaneous pregnancy prediction models in patients with one year of unexplained subfertility find that couples with a normal PCT are 4 times more likely to have a spontaneous pregnancy with a live birth than those with an abnormal PCT, after adjusting for the woman’s age, type and duration of subfertility, and referral by a general practitioner or specialist [HR 3.7; 95% CI: 1.09 – 12.7]. (6) (7) (8)
The increase in estrogens is associated with an increase in the content of NaCL and the crystallization of cervical mucus and saliva in the form of a fern when these secretions are seen under the microscope when dried.
Hand-held microscopes have been developed for use by the user to detect the time of ovulation through the analysis of the crystallization of saliva in the form of a fern (4). The recommendation is to perform the saliva test upon waking up or before or 3 hours after eating, drinking, or smoking. A drop of saliva from the sublingual region is placed on the crystal or lens of the microscope; wait about 10 minutes for the saliva to dry and then observe through the microscope in search of the presence of fern, incipient fern, or an irregular pattern of lines and spots.
Although initial studies suggest that salivary fern has a low capacity to predict ovulation with respect to ultrasound and serum LH in women with regular cycles, more recent studies show better sensitivity. A prospective study in 22 women between 22 and 34 years of age with regular menstruation showed that a kit consisting of a mini pocket microscope (x60) with a smartphone application that stores data on the menstrual cycle and sends alarms has a positive predictive value of 93.3% (95% CI 85.5 to 99.9%) and a sensitivity of 96.5% (95% CI 90.9a 99.9%) with respect to transvaginal ultrasound. In 12 anovulatory cycles, the kit presented 2 false positives, with a false positive rate of 16.7% and a negative predictive value of 90.9% (95% CI 82.1 to 99.7%). (9) (10)Fig2.

Fig 2 Knowhen ovulation Kit (10) Taken from https://www.knowhen.com/more/saliva-ovulation-test-kit.
A prospective study compared the accuracy of a hand-held microscope to visualize salivary fern with the evaluation of urinary LH to detect the fertility window in 74 women with regular menstrual cycles who underwent the examination between day 5 and 22 of each cycle. (11) The curve of the graph of the number of women with incipient fern and frank crystallization in the form of saliva fern with respect to the day of the menstrual cycle was parallel to the curve of women with a positive LH test, with a maximum of women with a positive test on days 16 and 17 of the cycle, respectively. This one-day difference is due to the sequence of hormonal peaks that occur in the menstrual cycle; the estrogen peak (responsible for the change in mucus) precedes the LH peak by 24 hours and ovulation occurs 9 to 12 hours after the LH peak
The quality and quantity of saliva can be affected by the intake of food, liquids, and medications, smoking, brushing teeth, and hydration status, among others. The FDA recommends its use as an aid in women with a desire for pregnancy; a positive result indicates that you may be in the fertility window (Fig 3)

Fig 3. Detection of fern crystallization of saliva (taken from Gunther et al. 2015 (11)
To avoid potential errors with self-assessment, WU, Hui-Ching et al. introduced at a recent academic meeting an automatic recognition system of the salivary fern pattern with a x100 digital camera and image processing with an accuracy of 84% in 100 salivary samples. (12)
Monitoring the increase in luteinizing hormone (LH) in a woman’s urine has been shown to be a reliable indicator of imminent ovulation and helps determine the two peak fertility days during the menstrual cycle. Ovulation usually occurs 24 to 36 hours after the start of the LH peak and 12 hours after it reaches its maximum level.
Estradiol is another key hormone that acts on the endometrium and cervix. The increase in the concentration of estradiol in the blood thickens the endometrium (inner layer of the uterine cavity where the embryos nest) making it receptive for implantation. It also thins the mucus of the cervix, facilitating the passage of sperm. The start of the estradiol peak precedes the LH peak, so measuring both hormones allows establishing 4 or more days of high fertility (fertility window).
The levels of the main metabolite of estradiol, estrone-3-glucuronide (E3G or E1G), increase substantially in the urine 3 to 4 days before ovulation, making it an excellent predictor of the start of the “fertility window.” Because sperm can live up to five days inside the female reproductive tract, knowing what the “fertility window” is by measuring E3G and LH in urine helps to plan the best time for intercourse more calmly.
Finally, measuring the hormone progesterone in serum about 7 days after ovulation retrospectively confirms whether ovulation actually occurred. Figure 4 shows the sequence of elevation of the hormones E3G, LH and progesterone throughout the menstrual cycle with respect to the time of ovulation.
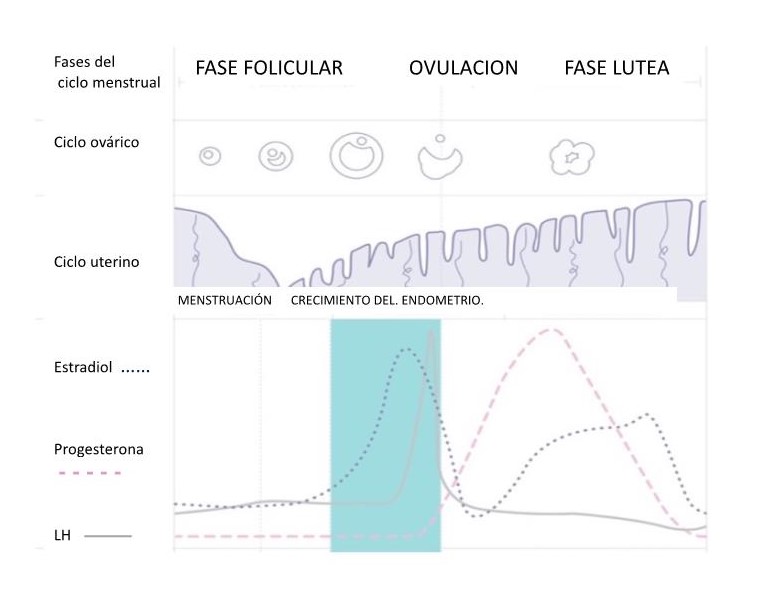
Fig 4. Sequence of elevation of the hormones estradiol, LH and progesterone throughout the menstrual cycle with respect to ovulation
- Detection of ovulation by analyzing the peak concentration of LH in the urine
It is possible to detect the increase in LH levels in the urine using home ovulation tests. The menstrual cycle can be from 21 to 35 days (counting from the first day of bleeding to the day before the next menstruation), so there may be a variation in the day of starting the ovulation prediction test in the urine.
Ultrasound monitoring of ovulation can define the day of initiation of ovulation predictor tests in the urine by detecting the dominant follicle responsible for the elevated production of estrogens. This usually appears about 4 days before ovulation, or about 18 days before the projected day of the next menstruation. The dominant follicle is visualized as a structure with liquid inside (echolucent) of about 14 mm that exceeds in size the other follicles present in the ovary.
In case of not having ultrasound monitoring of ovulation, it is advisable to define the day of initiation of ovulation predictor tests according to the length of the menstrual cycle. For example, if the menstrual cycle is 28 days, it is advisable to start performing the test once a day from day 11 of the menstrual cycle, but if it is 35 days it is suggested to start it later, approximately on day 18 of the menstrual cycle. Usually it is necessary to perform a test once a day for about 5 to 6 consecutive days to detect ovulation (Table 2).
| Cycle duration | 21 or less | 22 | 23 | 24 | 25 | 26 | 27 | 28 | 29 | 30 | 31 | 32 | 33 | 34 | 35 | 36 | 37 | 38 | 39 | 40 | 41 or more |
| Day of start of the test | 5 | 5 | 6 | 7 | 8 | 9 | 10 | 11 | 12 | 13 | 14 | 15 | 16 | 17 | 18 | 19 | 20 | 21 | 22 | 23 | start 17 days before the expected day of the next menstruation |
Table 2 Start of the ovulation test according to the duration of the menstrual cycle
A positive urine test result indicates an increase in the level of LH and ovulation in the next 24 to 48 hours. The peak fertility days are usually two (the day the test marks positive and the following day). Commercially available over-the-counter devices are found in the form of strips or devices in which the appearance of two stripes or a cross indicates imminent ovulation and others in the form of digital devices in which the appearance of a symbol such as a “smiley face”, indicates imminent ovulation (Fig 5a and 5b). Both devices have an absorbent tip that should be submerged in urine for a few seconds and after waiting a few minutes you can read the result following the instructions of each insert. (11) (13)
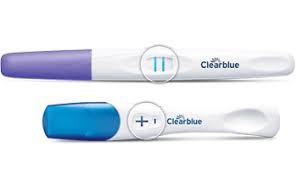
Fig 5a Ovulation tests
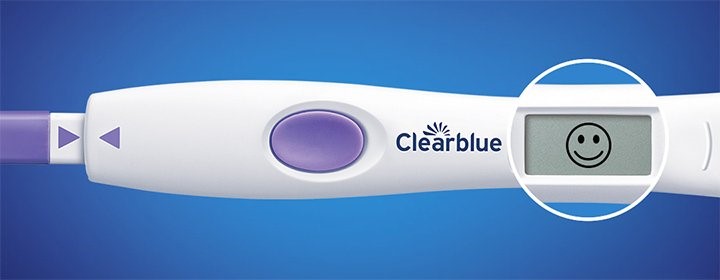
Fig 5b Digital ovulation test
In women with regular menstrual cycles, LH usually has a rapid rise and fall or a rapid rise with a slightly slower fall or a slow rise with a biphasic or plateau shape that translates into the following findings when performing the LH test in urine once a day (Fig 6a, Fig 6b, Fig 6c, Fig 6d, respectively). (4)
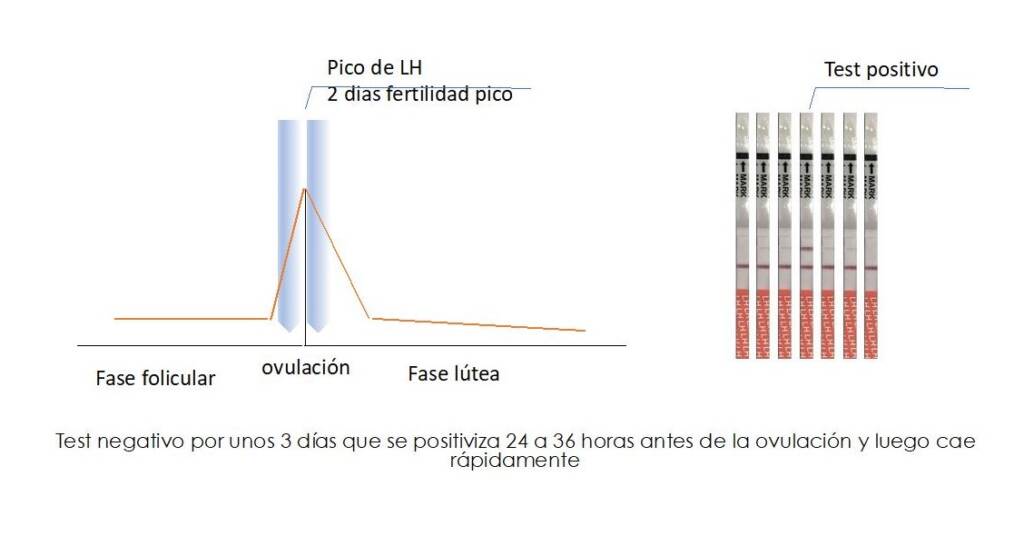
Fig 6a. Normal LH peak in urine: rapid rise and fall
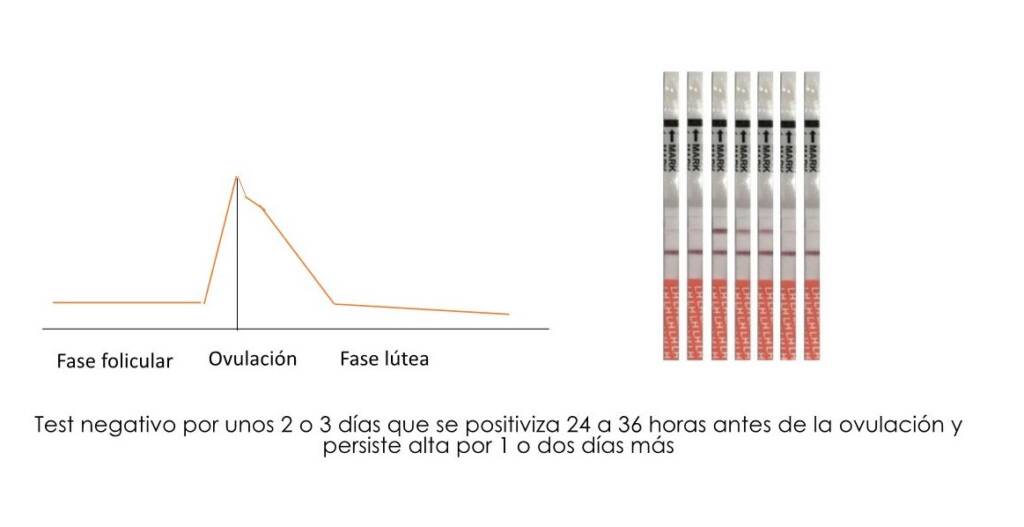
Fig 6b. Normal LH peak in urine: slow rise and fall
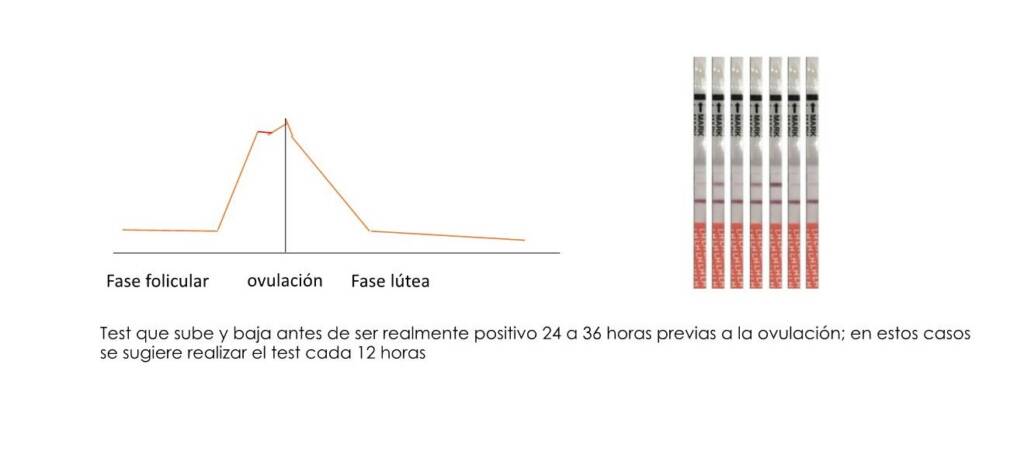
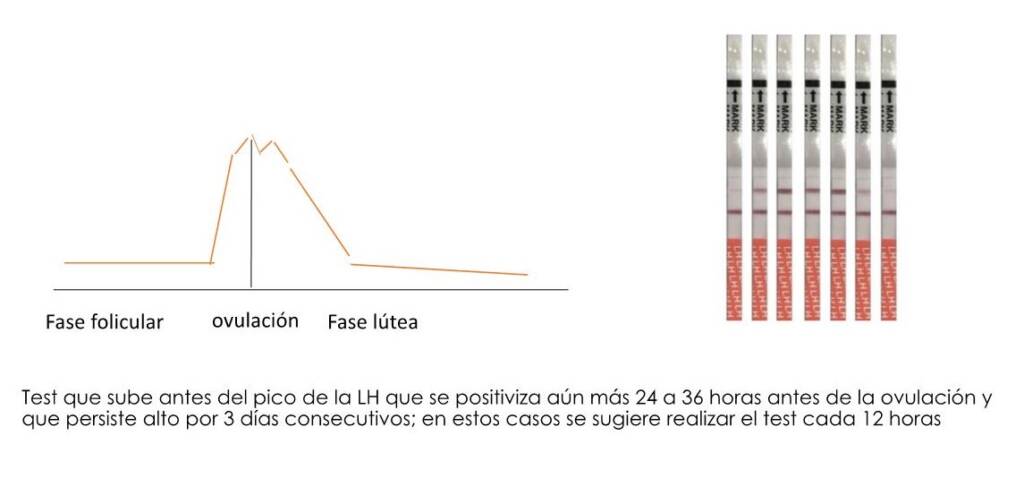
Fig 6d. Irregular LH peak in urine with lows and highs before and after the peak
In practice, therefore, predicting ovulation by detecting the increase of LH in urine may not be so easy, especially in women with hormonal problems and/or ovulation and/or menstruation disorders (e.g. polycystic ovary syndrome or premenopausal women) in whom an increase in LH can be observed without reaching the peak necessary to induce ovulation. In these cases it may be necessary to perform the test every 12 hours and consult a specialist doctor to corroborate the time of ovulation by transvaginal ultrasound.
- Detection of the ovulation window by measuring the estradiol metabolite E3G and LH in urine.
More recently, digital monitors have been introduced to the market to detect not only the LH peak indicative of imminent ovulation, but also the determination in urine of the estradiol metabolite (estrone-3-glucuronide – E1G or E3G) to visualize the fertility window in a more complete way. In a first cycle of use, it is advisable to start the tests on day 6 of the menstrual cycle and have about 10 devices available for use per month. The use of the first urine after the longest sleep is recommended.
In most women, up to 4 fertile days are identified each menstrual cycle, and in a quarter of women, between 5 and 9 days. The detection of the increase in E3G a few days before ovulation is defined as “high fertility” and the detection of the LH peak one day before ovulation and the day of ovulation as “peak fertility.” (13) In Figure 7, we can observe the relationship of the increase in the E3G metabolite and LH in urine with the high fertility and peak fertility stages, respectively. If peak fertility days are not detected in several cycles, it is recommended to consult a doctor.
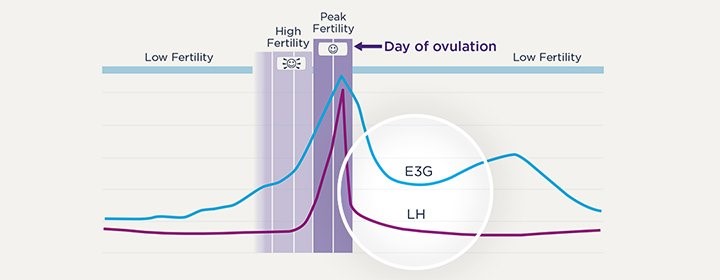
Fig 7. Test to determine the fertility window by measuring E3G and LH in urine. Taken from https://www.clearblue.com/ovulation-tests/advanced-digital
Fertility tracking software applications have been introduced to the market to schedule sexual intercourse (timed intercourse). A recent randomized study in 785 volunteers compared the probability of cumulative pregnancy at two menstrual cycles between users of an ovulation detection system connected to the Smartphone application that measures the LH hormone and an estrogen metabolite (E3G), compared with users who were exposed to pregnancy without ovulation tests. The proportion of women who became pregnant after one cycle was significantly higher in the group that used the application compared to the control group (25.4% vs 14.7%; p < 0.001, respectively) and after two cycles, the proportion of pregnant women was 36.2% vs. 28.6%; p = 0.026, respectively. (14) (13)
A previous study conducted in 653 women between 21 and 40 years of age with up to 2 years of infertility also showed a significant increase in the cumulative percentage of pregnancy during the first 2 months of use of a fertility monitor that detects both the LH peak and the levels of estrone-3-glucoronide (E3G) compared to a control group of women who used other methods of ovulation detection (22.7% vs 14.4%, respectively). Although the cumulative pregnancy rate was significantly higher in women with less than six months of seeking pregnancy, the use of this fertility window detection system increased the probability of pregnancy in women who were exposed to pregnancy for up to 2 years. This indicates that proper scheduling of intercourse is a factor to consider even in couples with infertility. (15)
Conclusion
There are different complementary alternatives that help predict the window and the maximum peak of fertility in addition to the length and duration of menstrual cycles with web-based applications. The information saved through these applications can assist in the medical management of patients who desire pregnancy. Failure to detect ovulation for three consecutive months or failure to conceive after 6 months of timed intercourse through applications that objectively detect the fertility window may be an indication to expedite the study process of a woman and her partner